Earlier we’ve explored the anatomy of a program in memory, the landscape of how our programs run in a computer. Now we turn to the call stack, the work horse in most programming languages and virtual machines. Along the way we’ll meet fantastic creatures like closures, recursion, and buffer overflows. But the first step is a precise picture of how the stack operates.
The stack is so important because it keeps track of the functions running in a program, and functions are in turn the building blocks of software. In fact, the internal operation of programs is normally very simple. It consists mostly of functions pushing data onto and popping data off the stack as they call each other, while allocating memory on the heap for data that must survive across function calls. This is true for both low-level C software and VM-based languages like JavaScript and C#. A solid grasp of this reality is invaluable for debugging, performance tuning and generally knowing what the hell is going on.
When a function is called, a stack frame is created to support the
function’s execution. The stack frame contains the function’s local variables
and the arguments passed to the function by its caller. The frame also
contains housekeeping information that allows the called function (the callee)
to return to the caller safely. The exact contents and layout of the stack vary
by processor architecture and function call convention. In this post we look at
Intel x86 stacks using C-style function calls (cdecl). Here’s a single stack
frame sitting live on top of the stack:
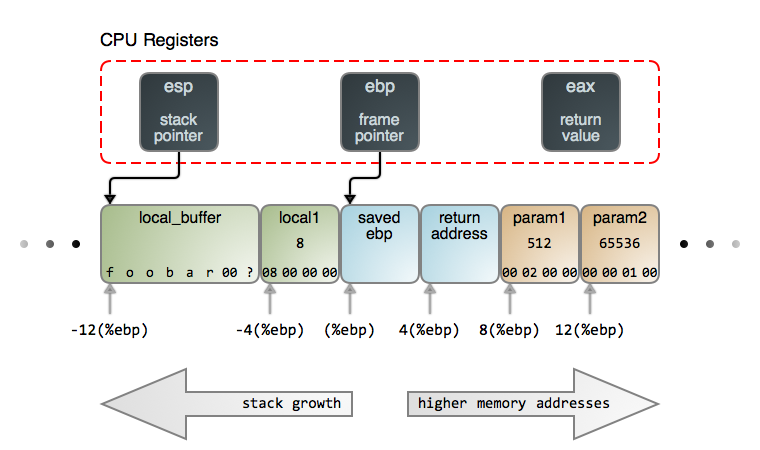
Right away, three CPU registers burst into the scene. The stack pointer,
esp, points to the top of the stack. The top is always occupied by the last
item that was pushed onto the stack but has not yet been popped off, just as
in a real-world stack of plates or $100 bills.
The address stored in esp constantly changes as stack items are pushed and
popped, such that it always points to the last item. Many CPU instructions
automatically update esp as a side effect, and it’s impractical to use the
stack without this register.
In the Intel architecture, as in most, the stack grows towards lower memory
addresses. So the “top” is the lowest memory address in the stack containing
live data: local_buffer in this case. Notice there’s nothing vague about the
arrow from esp to local_buffer. This arrow means business: it points
specifically to the first byte occupied by local_buffer because that is
the exact address stored in esp.
The second register tracking the stack is ebp, the base pointer or frame
pointer. It points to a fixed location within the stack frame of the function
currently running and provides a stable reference point (base) for access to
arguments and local variables. ebp changes only when a function call begins or
ends. Thus we can easily address each item in the stack as an offset from ebp,
as shown in the diagram.
Unlike esp, ebp is mostly maintained by program code with little CPU
interference. Sometimes there are performance benefits in ditching ebp
altogether, which can be done via compiler flags.
The Linux kernel is one example where this is done.
Finally, the eax register is used by convention to transfer return values back
to the caller for most C data types.
Now let’s inspect the data in our stack frame. These diagram shows precise byte-for-byte contents as you’d see in a debugger, with memory growing left-to-right, top-to-bottom. Here it is:
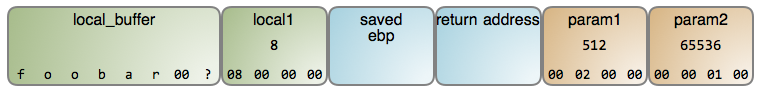
The local variable local_buffer is a byte array containing a null-terminated
ascii string, a staple of C programs. The string was likely read from somewhere,
for example keyboard input or a file, and it is 7 bytes long. Since
local_buffer can hold 8 bytes, there’s 1 free byte left. The content of this
byte is unknown because in the stack’s infinite dance of pushes and pops, you
never know what memory holds unless you write to it. Since the C compiler
does not initialize the memory for a stack frame, contents are undetermined
- and somewhat random - until written to. This has driven some into madness.
Moving on, local1 is a 4-byte integer and you can see the contents of each
byte. It looks like a big number, with all those zeros following the 8, but
here your intuition leads you astray.
Intel processors are little endian machines, meaning that numbers in memory start with the little end first. So the least significant byte of a multi-byte number is in the lowest memory address. Since that is normally shown leftmost, this departs from our usual representation of numbers. It helps to know that this endian talk is borrowed from Gulliver’s Travels: just as folks in Lilliput eat their eggs starting from the little end, Intel processors eat their numbers starting from the little byte.
So local1 in fact holds the number 8, as in the legs of an octopus. param1,
however, has a value of 2 in the second byte position, so its mathematical value
is 2 * 256 = 512 (we multiply by 256 because each place value ranges from 0 to
255). Meanwhile, param2 is carrying weight at 1 * 256 * 256 = 65536.
The housekeeping data in this stack frame consists of two crucial pieces: the address of the previous stack frame (saved ebp) and the address of the instruction to be executed upon the function’s exit (the return address). Together, they make it possible for the function to return sanely and for the program to keep running along.
Now let’s see the birth of a stack frame to build a clear mental picture of how
this all works together. Stack growth is puzzling at first because it happens
in the opposite direction you’d expect. For example, to allocate 8 bytes on
the stack one subtracts 8 from esp, and subtraction is an odd way to grow
something.
Let’s take a simple C program:
1 | int add(int a, int b) |
Suppose we run this in Linux without command-line parameters. When you run
a C program, the first code to actually execute is in the C runtime library,
which then calls our main function. The diagrams below show step-by-step what
happens as the program runs. Each diagram links to GDB output showing the state
of memory and registers. You may also see the GDB commands used and the whole
GDB output. Here we go:
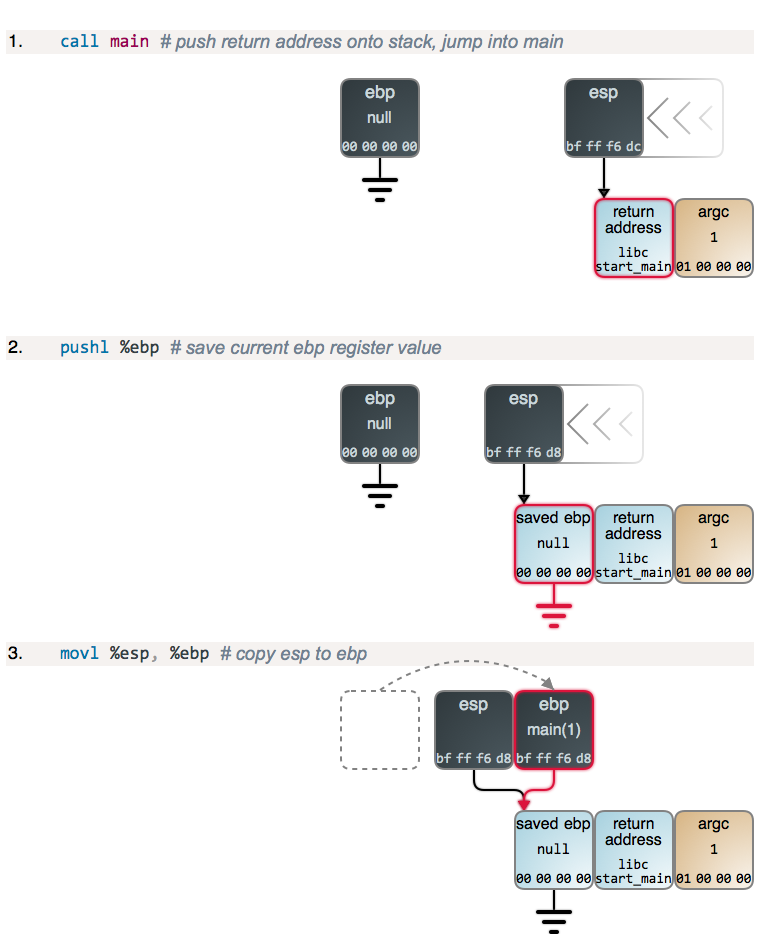
Steps 2 and 3, along with 4 below, are the function prologue, which is
common to nearly all functions: the current value of ebp is saved to the top of
the stack, and then esp is copied to ebp, establishing a new frame. main’s
prologue is like any other, but with the peculiarity that ebp is zeroed out
when the program starts.
If you were to inspect the stack below argc (to the right) you’d find more
data, including pointers to the program name and command-line parameters (the
traditional C argv), plus pointers to Unix environment variables and their
actual contents. But that’s not important here, so the ball keeps rolling
towards the add() call:
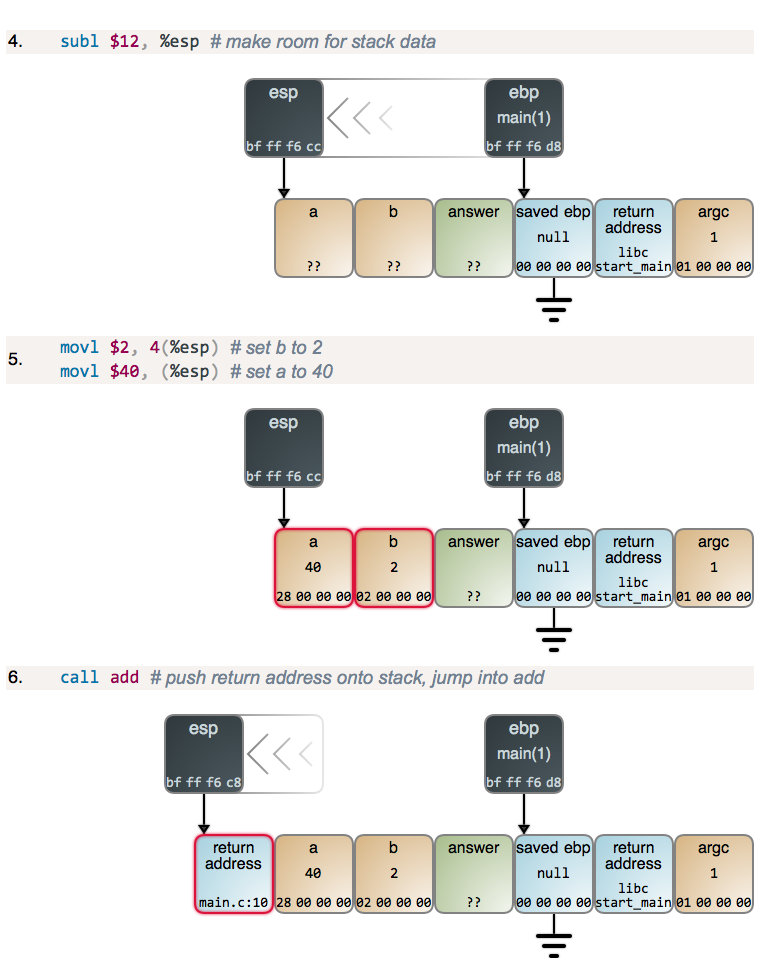
After main subtracts 12 from esp to get the stack space it needs, it sets
the values for a and b. Values in memory are shown in hex and little-endian
format, as you’d see in a debugger. Once parameter values are set, main calls
add and it starts running:
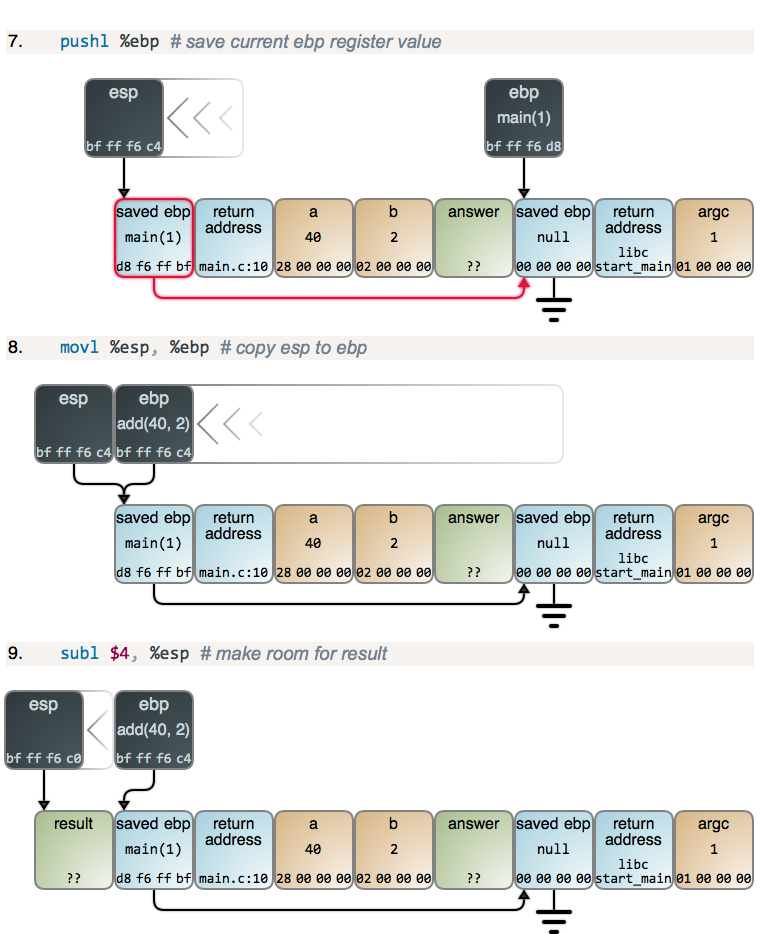
Now there’s some excitement! We get another prologue, but this time you can see
clearly how the stack frames form a linked list, starting at ebp and going
down the stack. This is how debuggers and Exception objects in higher-level
languages get their stack traces. You can also see the much more typical
catching up of ebp to esp when a new frame is born. And again, we subtract
from esp to get more stack space.
There’s also the slightly weird reversal of bytes when the ebp register value
is copied to memory. What’s happening here is that registers don’t really have
endianness: there are no “growing addresses” inside a register as there are for
memory. Thus by convention debuggers show register values in the most natural
format to humans: most significant to least significant digits. So the results
of the copy in a little-endian machine appear reversed in the usual
left-to-right notation for memory. I want the diagrams to provide an accurate
picture of what you find in the trenches, so there you have it.
With the hard part behind us, we add:
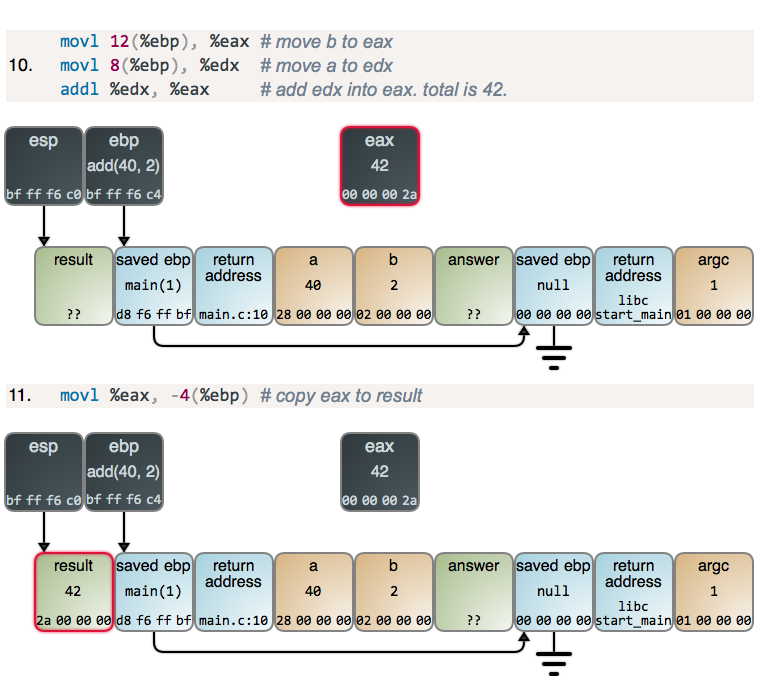
There are guest register appearances to help out with the addition, but
otherwise no alarms and no surprises. add did its job, and at this point the
stack action would go in reverse, but we’ll save that for next time.
Anybody who’s read this far deserves a souvenir, so I’ve made a large diagram showing all the steps combined in a fit of nerd pride.
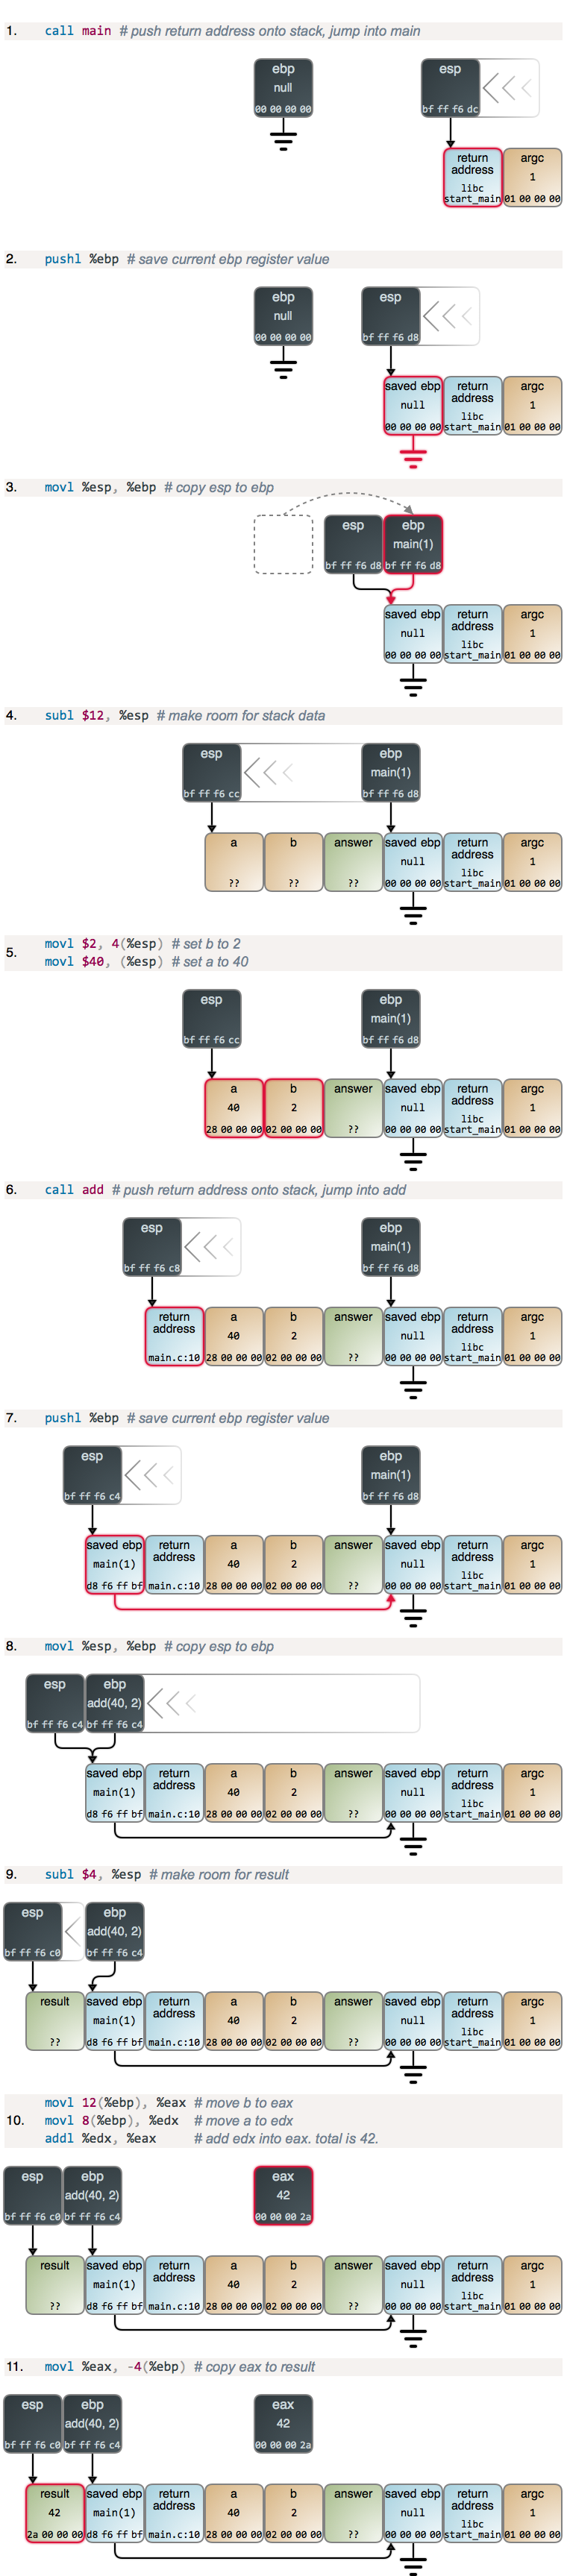
It looks tame once it’s all laid out. Those little boxes help a lot. In fact, little boxes are the chief tool of computer science. I hope the pictures and register movements provide an intuitive mental picture that integrates stack growth and memory contents. Up close, our software doesn’t look too far from a simple Turing machine.
This concludes the first part of our stack tour. There’s some more byte spelunking ahead, and then it’s on to see higher level programming concepts built on this foundation. See you next week.
Comments